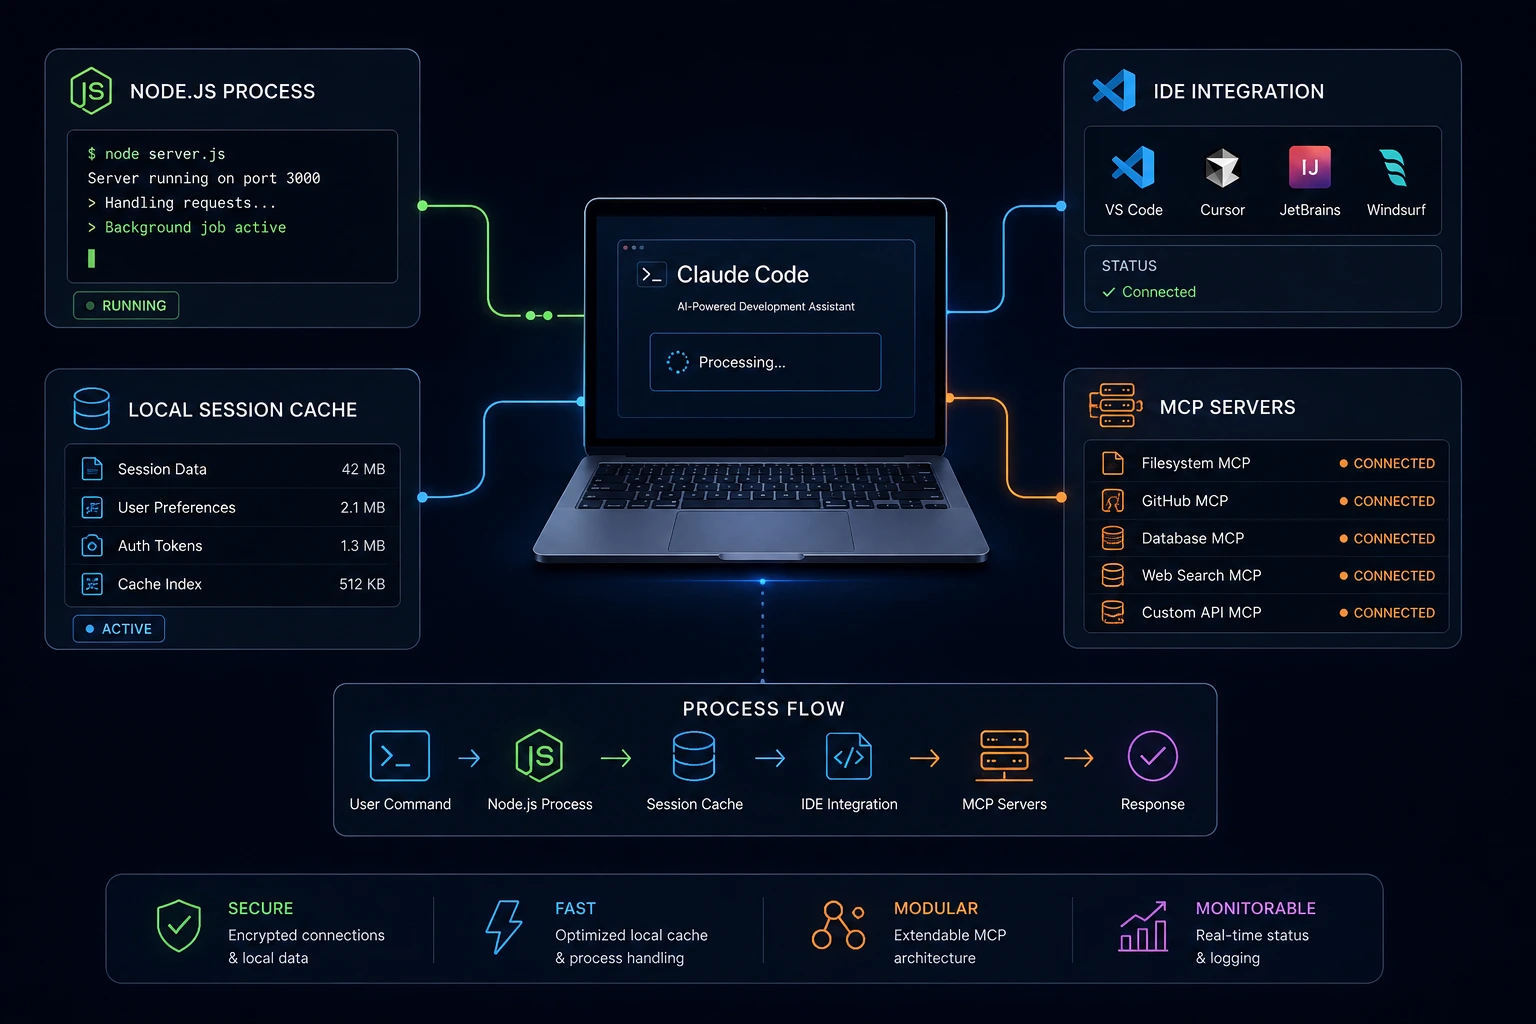
If your fan spins up, your laptop gets hot, or your machine slows down whenever Claude Code is running, you're not imagining it. Claude Code is an agentic coding tool it runs as a Node.js process in your terminal, searches your codebase, executes shell commands, talks to MCP servers, and can spin up subagents to work in parallel. Some CPU usage during active work is expected. But high, sustained CPU usage especially while Claude Code is sitting idle is a real, documented problem that Anthropic's own troubleshooting docs address directly, and one that shows up repeatedly in open GitHub issues.

This guide combines Anthropic's official troubleshooting guidance with real, reported cases (including exact root causes and workarounds) so you can diagnose what's happening on your machine and fix it not just guess.
Who this is for: developers, AI power users, and beginners running Claude Code locally who've noticed high CPU usage, fan noise, system lag, or high memory usage alongside it.
Quick Answer: Why Is Claude Code Using So Much CPU?
Anthropic's own documentation confirms that Claude Code is designed to work with most development environments but may consume significant resources when processing large codebases. Beyond that expected load, three patterns show up repeatedly in real reports:
Idle-state CPU bugs. Multiple open GitHub issues describe Claude Code processes pinning at 50–130% CPU while completely idle, mostly on Linux and WSL2.
An oversized local session cache. A confirmed, reproducible bug ties near-100% CPU on startup to an overgrown ~/.claude/projects/ history folder with a known workaround.
Terminal/IDE integration issues. Running Claude Code inside certain IDE integrated terminals (JetBrains IDEs, VS Code, Cursor) has been linked to high CPU tied to terminal rendering or unhandled control sequences.
The fastest way to confirm which one applies to you is to check what's actually consuming CPU at the process level (Step 1 below), then work through Anthropic's official fixes before assuming it's an unfixable bug.
What Anthropic's Official Troubleshooting Docs Say
Claude Code has a dedicated performance and stability section in its official troubleshooting page. According to that page, if you're experiencing high CPU or memory usage, Anthropic's recommended steps are, in order:
Use /compact regularly to reduce context size if it returns "Not enough messages to compact," the conversation has too few turns to summarize, which can happen even with a full context after one large paste.
Close and restart Claude Code between major tasks.
Add large build directories to your .gitignore file.
Restart with claude --safe-mode to check whether a plugin, MCP server, or hook is the source — this disables all customizations for the session, and if usage drops, you can narrow down the culprit from there.
If memory stays high after that, Anthropic recommends running /heapdump, which writes a JavaScript heap snapshot and a memory-breakdown diagnostics file to your Desktop (or home directory on Linux without a Desktop folder). Important: the heap snapshot file contains every string in the process, including your full conversation and credentials, so it should never be attached to a public issue; only the diagnostics JSON is safe to share when reporting a bug.
The same page also flags two other performance-adjacent issues worth knowing about:
Terminal rendering problems (garbled or corrupted text) in VS Code, Cursor, or Devin Desktop's integrated terminal are usually caused by the terminal's GPU renderer, fixed by running /terminal-setup inside Claude Code to disable GPU acceleration.
If search, @file mentions, or custom agents aren't finding files, the bundled ripgrep binary may not run on your system; this isn't a CPU issue by itself, but a broken search layer can cause Claude Code to retry or scan more aggressively than it should.
Real Reported Cases (With Root Causes)
These aren't hypothetical; they're drawn from open GitHub issues on the official anthropics/claude-code repository and community reports, current as of early 2026.
1. Sustained 100%+ CPU While Idle (Multiple Open Reports)
Two separate GitHub issues describe nearly identical symptoms: Claude Code consuming very high, sustained CPU even when no task is running and no output is being streamed.
Issue #19393 reported two Claude Code instances on Ubuntu/WSL2 pinning at roughly 60–130% CPU each while idle, making the terminal unresponsive and causing typing lag even in VS Code.
Issue #22275 reported two instances on Linux Mint each sustaining around 100% CPU continuously between interactions, with no MCP servers configured at all ruling out MCP servers as the cause in that specific case, and pointing at the core Claude Code process itself.
Both were filed as bugs and tagged for the core engine and Linux platform. If you're on Linux or WSL2 and see this, you're not alone; it's a known, tracked issue rather than something wrong with your setup.
2. Startup CPU Hang From an Oversized Session Cache (Confirmed Root Cause + Fix)
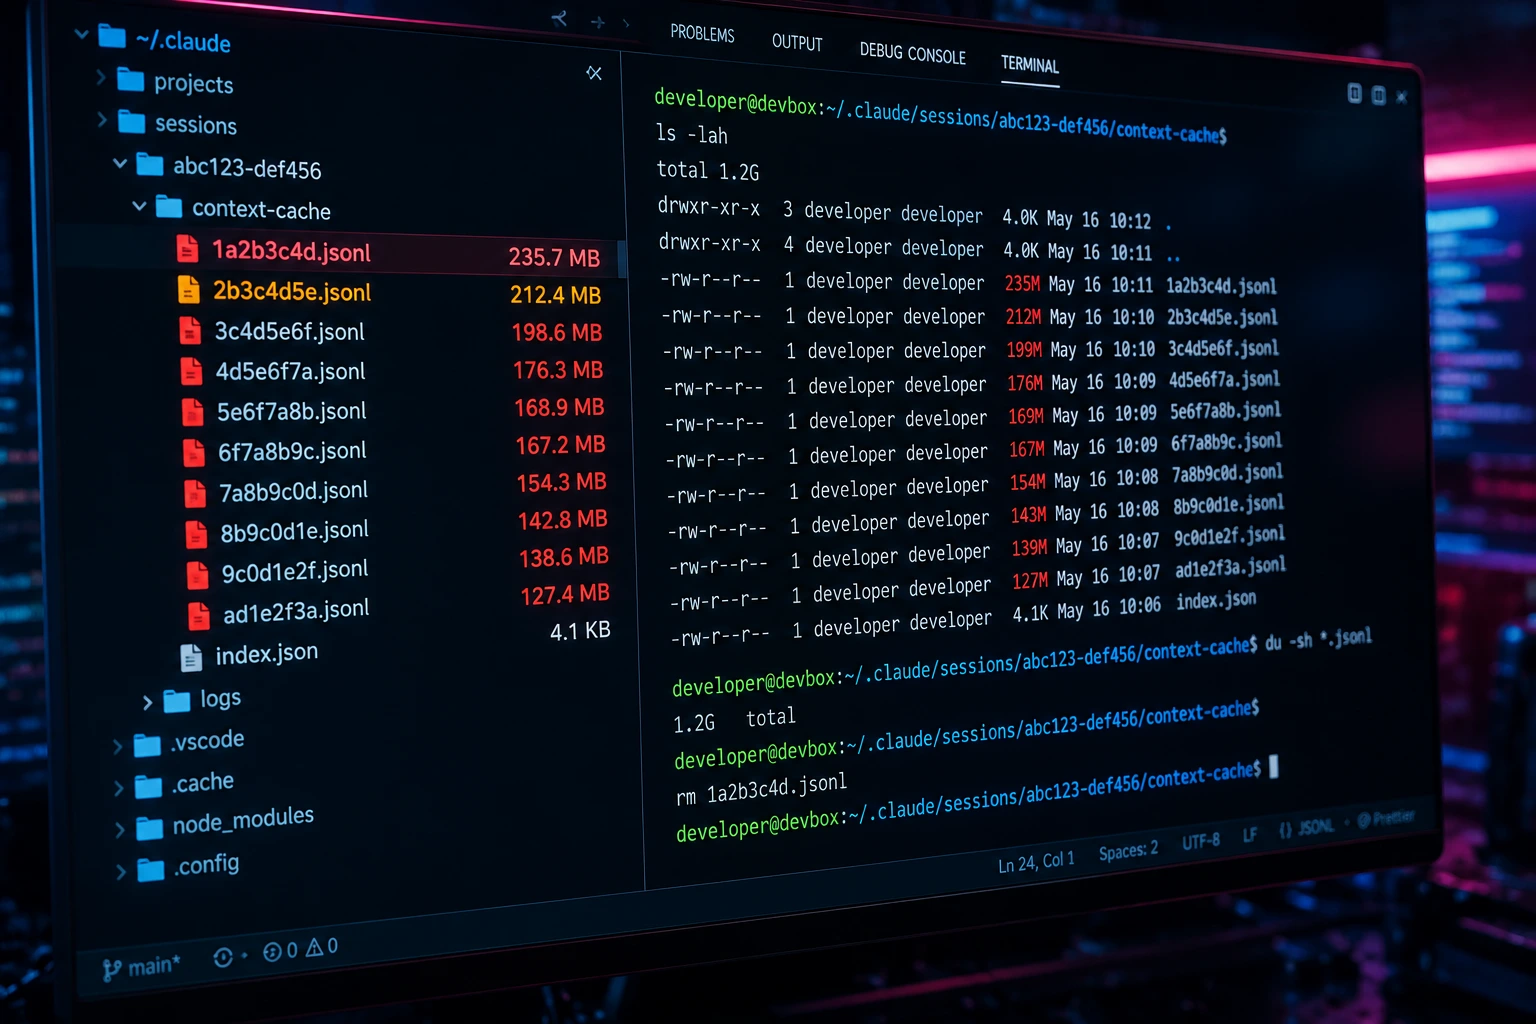
Issue #22185 is the most actionable of the reports, because the reporter found and confirmed the exact cause: Claude Code stores session history per project under ~/.claude/projects/<project-hash>/. In their case this folder had grown to 216MB across 75 files, with some individual .jsonl session files over 20MB. Launching Claude Code in that project or even running a simple command like /usage caused the CLI to hang at 100% CPU indefinitely.
The workaround that resolved it:
rm -rf ~/.claude/projects/<project-hash>
This deletes the accumulated local session history for that project. Note this removes your resumable session history for that project, so treat it as a last resort once you've confirmed a bloated cache is the cause, not a first response.
3. High CPU Tied to IDE Integrated Terminals
A JetBrains YouTrack report (IDEA-381410) documents high CPU usage specifically when running Claude Code inside a JetBrains IDE's integrated terminal, alongside "Unhandled Control Sequence" errors in the IDE log pointing to a terminal-emulation compatibility issue rather than something wrong with Claude Code's core logic. This lines up with Anthropic's own note about terminal GPU rendering issues in VS Code/Cursor above; if your high CPU only appears inside an IDE's built-in terminal and not in a standalone terminal app, the integration layer is the more likely suspect.
4. Load That Multiplies Across Many Idle Sessions
A support thread on the Coder.com Discord (archived via Answer Overflow) reported that each idle Claude Code instance in a cloud/self-hosted workspace was using roughly 6% CPU about one core's worth at all times. In a fleet of 10+ workspaces, that idle overhead alone was enough to max out the server. If you run Claude Code across many parallel workspaces, containers, or CI environments, this per-instance idle overhead adds up fast even before anyone is actively using it.
5. Subagents Pushing CPU Over 100%
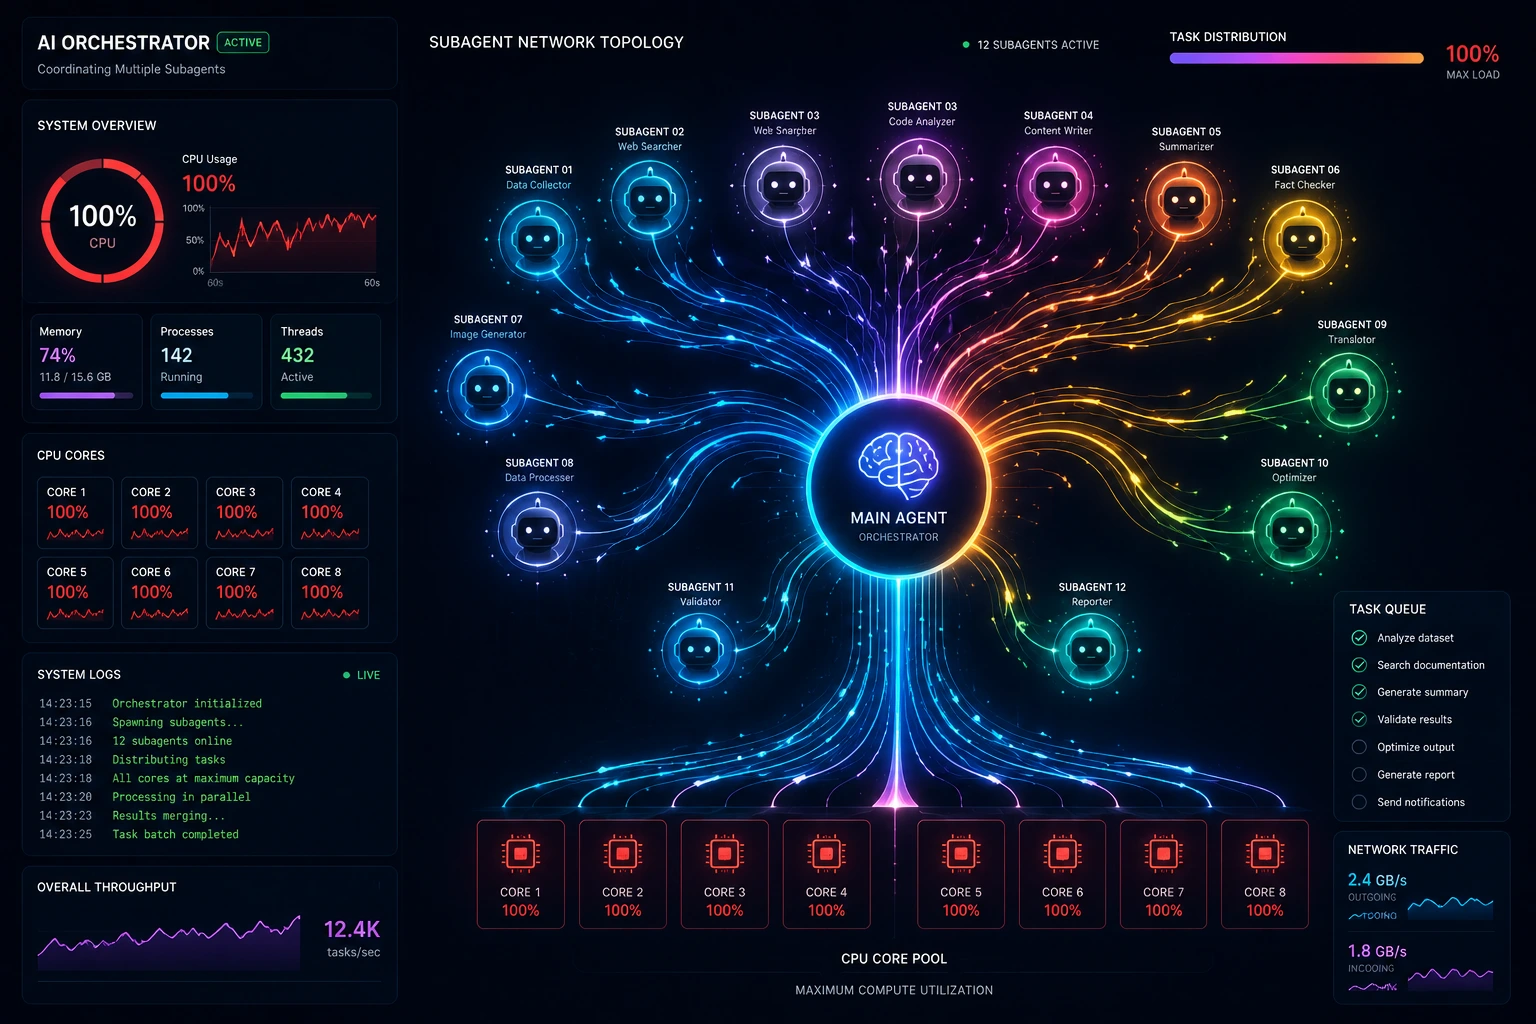
Community reports (including threads on r/ClaudeAI) describe CPU usage climbing past 100% specifically when running multiple subagents in parallel via the Task tool. This matches how subagents work by design; each subagent uses its own separate context window and can be configured with its own tools, and running several concurrently means several effectively independent working processes competing for the same CPU cores. This isn't necessarily a bug; it's a resource trade-off of parallelism that's worth being deliberate about on machines with fewer cores.
6. Some Evidence Recent Versions Have Improved
Independent testing by at least one developer (published analysis, not an official Anthropic statement) reported measuring their own idle Claude Code session at under 3% of one core after updating, and cited Anthropic's changelog for a claimed reduction in 99th-percentile CPU usage across sessions. Treat this as anecdotal rather than a guaranteed fix, but it reinforces the same advice as everything else here: update first, then diagnose.
Step-by-Step Solutions
Step 1: Identify the Actual Process Consuming CPU
Before changing anything, confirm what's really using the CPU.
macOS/Linux: run top or htop and sort by CPU usage.
Windows: open Task Manager and sort by CPU.
Look at whether the load is under claude, node, an MCP server process name, or a completely unrelated application (editor, sync client, antivirus) reacting to file changes.
Expected result: You'll know whether this is Claude Code's core process (matches the idle-CPU bug pattern), a subagent, an MCP server, or something else entirely.
Step 2: Run /doctor and Update
Inside Claude Code, run:
/doctor
This gives an automated check of your installation, settings, extensions, and context usage, and proposes fixes it can apply after you confirm. If claude won't start at all, run claude doctor from your shell instead. Then update to the latest version, since performance fixes ship regularly and several of the CPU issues above are still being actively tracked and worked on.
Expected result: Known configuration problems get flagged, and any CPU fixes already shipped in newer releases take effect.
Step 3: Compact Your Context and Restart Between Tasks
Run /compact to reduce context size during a long session, and get in the habit of closing and restarting Claude Code between unrelated major tasks rather than letting one session run indefinitely. This is Anthropic's own first-line recommendation for high CPU/memory.
Expected result: Lower memory pressure, which in turn tends to reduce CPU spent on garbage collection.
Step 4: Check for an Oversized Project Cache
If CPU usage spikes specifically on launch or on simple commands like /usage, check the size of your project's session cache:
bash
du -sh ~/.claude/projects/*
If a specific project folder is unusually large (tens or hundreds of MB), that matches the confirmed pattern from issue #22185. As a last resort, after confirming this is the cause:
bash
rm -rf ~/.claude/projects/<project-hash>
Expected result: CPU usage on startup returns to normal, at the cost of losing resumable session history for that project.
Step 5: Isolate Plugins, MCP Servers, and Hooks
Restart with:
bash
claude --safe-mode
This disables all plugins, MCP servers, and hooks for the session. If CPU usage drops, one of your customizations is the source — re-enable them one at a time (or check /mcp for server status) to find which one.
Expected result: If a specific MCP server or hook was the cause, CPU returns to normal in safe mode and spikes again once that customization is re-enabled — confirming exactly where to focus.
Step 6: Scope Your Project Directory and Ignore Rules
Run Claude Code from the specific project you're working in rather than a root directory containing multiple unrelated projects, and make sure build output and dependency folders are excluded via .gitignore, per Anthropic's own recommendation.
Expected result: Less to scan means lower baseline CPU during normal search and file operations.
Step 7: Limit Parallel Subagents
If you're intentionally running multiple subagents, reduce how many run at once, especially on a machine with fewer CPU cores. Let one batch finish before starting the next if you notice sustained high load correlating with parallel tasks.
Expected result: CPU usage drops proportionally to the number of concurrent subagents.
Step 8: Check the IDE's Integrated Terminal Specifically
If high CPU only happens inside an IDE's built-in terminal (JetBrains, VS Code, Cursor) and not in a standalone terminal app, run /terminal-setup inside Claude Code to disable GPU acceleration for the integrated terminal, per Anthropic's documented fix for related rendering issues.
Expected result: If the IDE terminal integration was the cause, CPU usage normalizes when run outside the IDE, confirming the terminal layer as the source.
Step 9: Capture a Heap Dump and Report It
If CPU or memory usage is still high after all of the above, run:
/heapdump
This writes a heap snapshot and a diagnostics JSON file, and prints a summary in the conversation showing memory breakdown and any detected leak indicators. Open a GitHub issue and attach only the diagnostics JSON file — never the heap snapshot, since it contains your full conversation content and credentials.
Expected result: You have a genuine, reportable bug with diagnostic evidence, and Anthropic's team has what they need to investigate.
Advanced Tips for Developers
Check known issues before deep debugging. Given how many open GitHub issues already describe idle-CPU spikes on Linux/WSL2, search the issue tracker for your symptoms and OS before assuming it's something local to your machine you may just need to add a 👍 and watch for a fix rather than chase a local cause that doesn't exist.
Watch memory alongside the CPU. High memory usage can drive CPU usage through more frequent garbage collection, particularly in long sessions with large context or an oversized project cache (see issue #22185 above).
On WSL, I prefer the Linux filesystem. Anthropic's docs note that working across file systems on WSL can cause disk read performance penalties affecting search; keeping your project on the Linux filesystem (/home/) rather than /mnt/c/ avoids this entirely.
Use /feedback for issues without a clean repro. If you can't isolate a cause but the symptom is clearly abnormal, Anthropic's own guidance is to use the /feedback command inside Claude Code to report it directly.
Common Mistakes to Avoid
Assuming it's always your project's fault. Several of the highest-CPU reports above happen even with no MCP servers configured and no active task; they're core-process bugs on specific platforms, not misconfiguration.
Deleting the entire ~/.claude/projects/ folder pre-emptively. Only remove a specific project's cache after confirming (via du -sh) that it's actually oversized; this deletes your resumable session history.
Skipping --safe-mode and guessing which MCP server is the problem. It's faster and more reliable than disabling servers one at a time from a hunch.
Attaching a .heapsnapshot file to a public bug report. It contains full conversation content and credentials only the diagnostics JSON is safe to share.
Running many parallel subagents on a low-core machine without noticing the trade-off. It's a resource cost of parallelism, not a bug, and it's easy to fix by simply running fewer at once.
Best Practices and Prevention Tips
Keep Claude Code updated several of the CPU issues above are actively being tracked, and fixes ship in regular releases.
Periodically check ~/.claude/projects/ size with du -sh ~/.claude/projects/* for long-lived projects, especially ones you've worked in for weeks.
Run /compact regularly in long sessions instead of letting context (and memory) grow unbounded.
Maintain a clean .gitignore so build output and dependencies aren't scanned unnecessarily.
Be deliberate about how many subagents you run in parallel relative to your machine's core count.
If you work inside a JetBrains IDE, VS Code, or Cursor's integrated terminal and notice high CPU, test the same session in a standalone terminal to isolate whether the IDE integration is involved.
If you're the only one seeing an issue, check open GitHub issues first if others are reporting the same symptoms, add your environment details there instead of troubleshooting from scratch.
Frequently Asked Questions
Both are possible. Anthropic's official docs treat significant resource usage on large codebases as expected behavior with recommended mitigations. But sustained high CPU while genuinely idle matches multiple open, tagged bug reports (for example #19393 and #22275) — if that's your exact symptom, it may not be something you can fully fix locally yet.
It's a built-in diagnostic command that writes a memory snapshot and a diagnostics summary. The diagnostics JSON is safe to attach to a bug report; the .heapsnapshot file is not, since it contains your full conversation and credentials.
It deletes your local resumable session history for that project (the ability to pick up past conversations), not your actual code or files. Only delete it after confirming an oversized cache is genuinely causing the CPU spike.
No — model choice affects response quality and API cost, not local CPU usage. Local CPU load comes from the Claude Code process itself, file operations, search, subagents, and connected tools running on your machine.
Yes. A documented JetBrains IDE issue ties high CPU specifically to running Claude Code inside the IDE's integrated terminal, alongside terminal rendering errors — testing in a standalone terminal is the fastest way to rule this in or out.
Not necessarily — but disable ones you're not actively using for the current project, and use claude --safe-mode to check whether a specific server is contributing to CPU usage before assuming it is.
Use /feedback inside Claude Code, or open an issue on the official GitHub repository, including your OS, Claude Code version, and — ideally — the diagnostics JSON from /heapdump.
Conclusion
Claude Code high CPU usage isn't always a mystery, and it isn't always your fault either. Anthropic's official troubleshooting guidance /compact, restarting between tasks, .gitignore hygiene, and claude --safe-mode to isolate plugins, MCP servers, and hooks resolves a large share of cases. But a meaningful number of reports point to specific, documented causes: sustained idle-state CPU bugs tracked in open GitHub issues (mostly Linux/WSL2), an oversized ~/.claude/projects/ session cache with a confirmed one-line fix, and IDE integrated-terminal rendering issues.
Work through the process-identification step first, apply Anthropic's official fixes, then check whether your exact symptoms match one of the specific reported cases above. If they don't and you've isolated a clean reproduction capture a /heapdump diagnostics file and report it through /feedback or GitHub so it can be properly investigated, rather than continuing to troubleshoot blind.