Introduction
Claude Code is Anthropic's agentic coding tool that runs in your terminal, reading files, running commands, and editing code on your behalf. That constant reading, indexing, and context-tracking is exactly what makes Claude Code high memory usage a real and fairly common complaint, especially during long sessions or on large codebases.
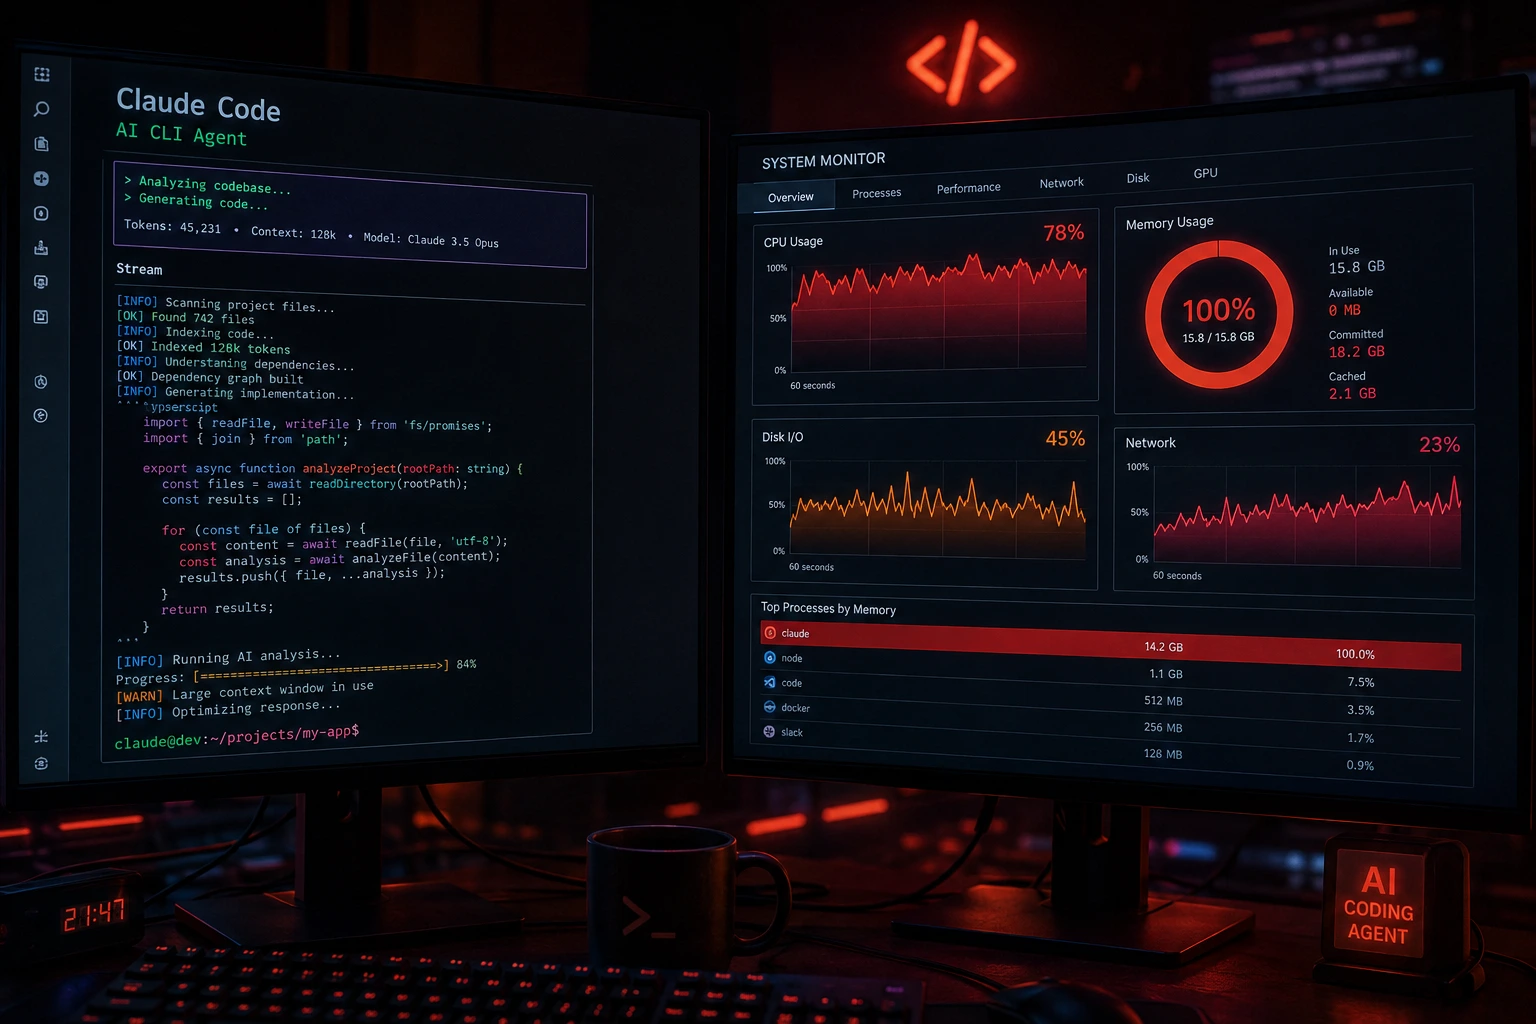
This isn't just anecdotal grumbling. Anthropic's own Claude Code troubleshooting documentation has a dedicated "High CPU or memory usage" section, and multiple issues filed on the official Claude Code GitHub repository describe memory climbing into the tens or even 100+ gigabytes before the operating system's out-of-memory (OOM) killer steps in or the machine locks up entirely.
This article explains why Claude Code's memory usage climbs, how to tell whether you're dealing with normal (if heavy) resource use versus an actual leak, and the specific, documented steps to bring it back under control including the built-in diagnostic commands Anthropic provides for exactly this problem.
Direct Answer: Why Is Claude Code Using So Much Memory?
Claude Code's memory usage typically climbs for one of these reasons: large or long-running sessions that accumulate context, big codebases or build directories getting scanned, a misbehaving plugin, MCP server, or hook, or in the more severe cases documented on GitHub an unresolved memory leak in specific versions of the tool.
The fastest checks, in order:
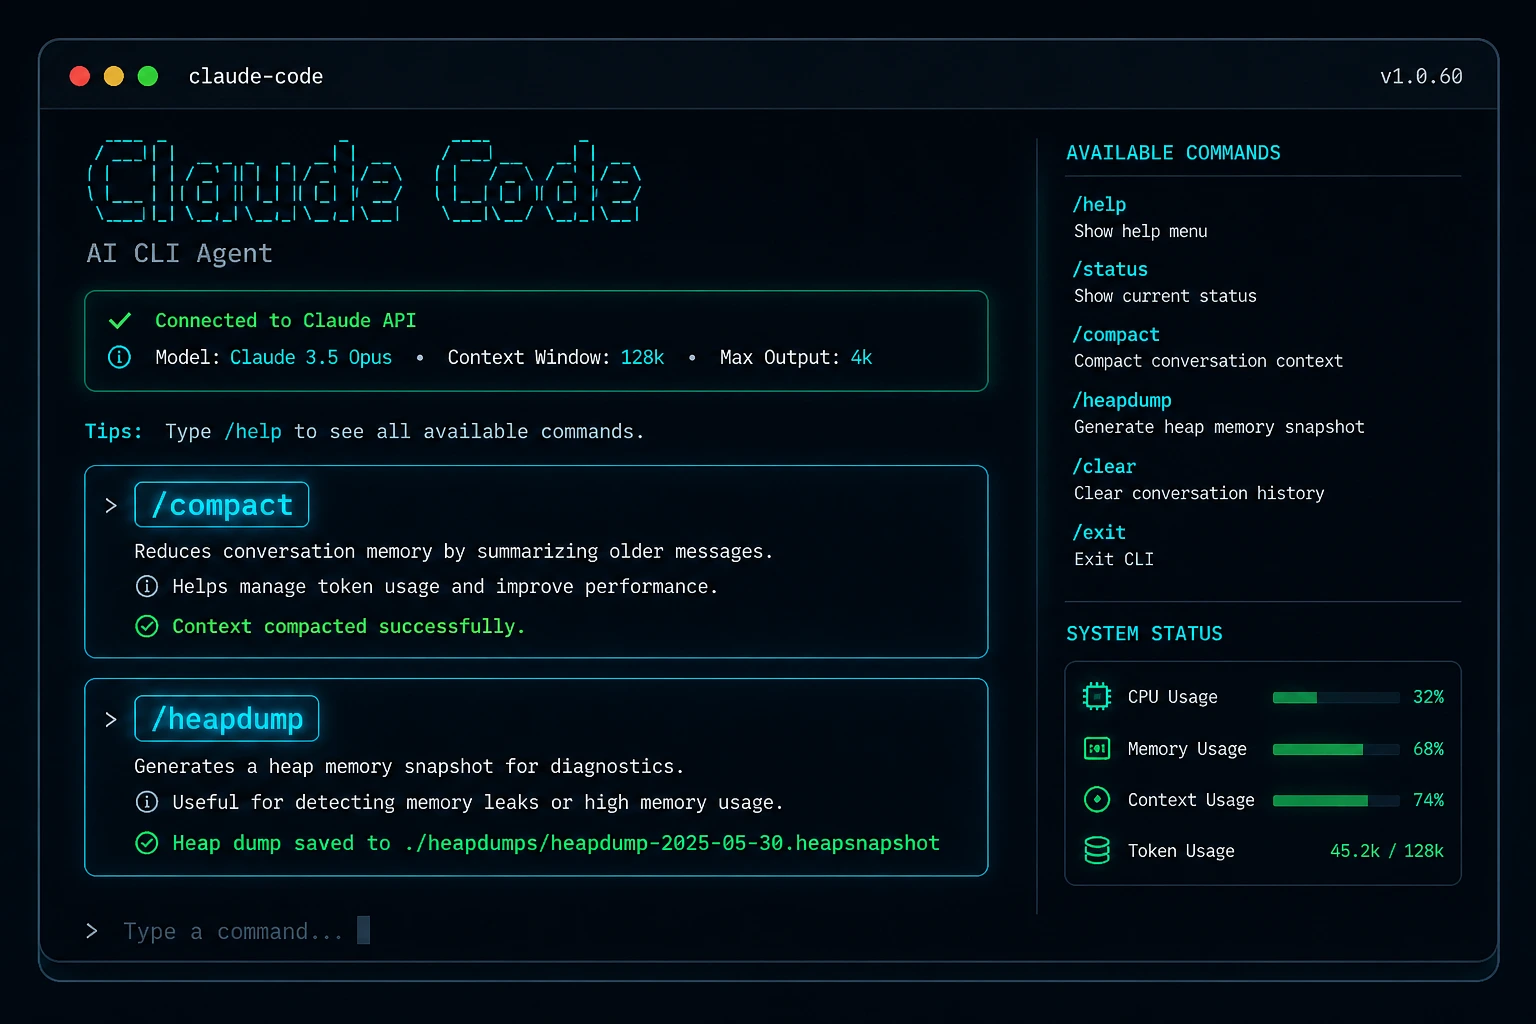
Run /compact to shrink your conversation context.
Restart Claude Code with claude --safe-mode to see if a plugin, hook, or MCP server is responsible.
If memory is still high, run /heapdump to generate diagnostic files you can inspect or attach to a bug report.
If you're on an older version, updating Claude Code is also worth doing before anything else; some memory-related bugs reported on GitHub, including one Linux issue where usage reached 50GB, were resolved simply by updating to a newer release.
Background: How Claude Code Uses Memory
Claude Code isn't just sending text to an API and printing the reply. While a session runs, it typically holds onto:
Conversation context the accumulated back-and-forth, file contents you've shown it, and command output.
File and codebase indexing data used for search and @file references, particularly in large repositories.
Background processes MCP servers, hooks, and plugins you've enabled, each running as separate or attached processes.
Native memory buffers and allocations outside the JavaScript heap, which behave differently from the memory used to store the conversation itself.
Under normal conditions, none of this should be extreme. Anthropic's documentation frames typical usage as "significant resources when processing large codebases," not runaway growth. When usage instead grows continuously over a session, hits double-digit gigabytes, or triggers an OOM kill, that points to something more specific, usually one of the causes below.
Note on terminology: Searching "Claude Code memory problem" also turns up a completely different issue: Claude forgetting project context and decisions between sessions (people work around this with CLAUDE.md notes or MCP-based memory plugins). That's a context-continuity problem, not a RAM problem, and the fixes for it are unrelated to what's covered here.

Main Causes of High Memory Usage in Claude Code
1. Long or context-heavy sessions
The longer a single Claude Code session runs and the more file content, command output, or large pastes it accumulates, the larger its in-memory context becomes. This affects any user running extended sessions without periodically clearing or compacting context, and it's the most common, least alarming cause.
How to identify it: Memory grows steadily and roughly tracks how long the session has been open and how much you've pasted or had it read.
2. Large codebases and build directories
Working inside a large repository, especially one that includes build output, node_modules, or other generated directories that aren't excluded from version control can push Claude Code to scan and hold far more file data than necessary.
How to identify it: Memory usage is disproportionately high relative to session length, and the project has large, uncommitted build or dependency folders.
3. Plugins, hooks, or MCP servers
Claude Code supports custom plugins, hooks, and MCP (Model Context Protocol) server connections. A misbehaving one of these for example, a status-line plugin or a hung MCP server can hold memory or, in at least one documented GitHub report, spawn processes rapidly enough to affect the whole system.
How to identify it: Running Claude Code in --safe-mode, which disables all customizations for the session, makes the problem disappear.
4. Underlying memory leaks in specific versions
Several GitHub issues describe memory climbing to 50GB, 120GB, or beyond over the course of a session well past what normal context accumulation would explain — including cases where the process was eventually killed by the Linux OOM killer or caused a full system freeze. These reports point to genuine leaks in the affected versions rather than expected resource use. This is a case where Claude Code's behavior is not simply resource-intensive but actually defective, and the practical fix is usually to update or report the issue rather than change your workflow.
How to identify it: Memory grows well beyond what your session activity would justify, --safe-mode doesn't fix it, and restarting only delays the same growth pattern from recurring.
5. Idle sessions that keep growing with no activity at all
This is a distinct and heavily reported pattern: memory climbs even while a Claude Code session sits open and untouched. Multiple GitHub issues describe this independently growth rates reported anywhere from roughly 80MB/min up to 2GB/min while idle, on Windows, macOS, Linux, and WSL2 alike, with some sessions reportedly reaching 15–22GB after being left open for hours with no user interaction.
One report on an otherwise-idle session found the context size hadn't changed at all during the growth period, pointing away from simple context accumulation and toward something in the underlying process itself (V8 heap fragmentation and MCP connection handling have been suggested as possibilities, though not officially confirmed).
As of this writing, a number of these idle-growth issues have been closed as duplicates of one another without a confirmed fix, so if you hit this pattern, restarting periodically remains the most reliable workaround.
How to identify it: Memory increases steadily on a session where you aren't actively typing, running commands, or having Claude do anything; the clearest sign this isn't a context-size problem.
6. Orphaned or "zombie" child processes
Claude Code sessions can spawn child processes — MCP servers, subagents, headless browsers for testing, or file-watching build tools. When a session ends abnormally (a crash, a force-quit, or just closing the terminal window instead of exiting cleanly), those children don't always get cleaned up. They keep running in the background, and over a day of heavy use, several of these orphaned processes stacking up can account for multiple gigabytes of RAM that has nothing to do with Claude Code's own memory usage in the moment — it looks like Claude Code is the problem, but the process actually causing the drag is an abandoned child process from an earlier session.
How to identify it: Check your process list (Activity Monitor, Task Manager, or ps aux) for multiple Node.js, browser, or MCP-related processes that persist after you've closed Claude Code entirely.
7. Claude Desktop's Windows virtual machine (not the CLI)
This one is specific to the Claude Desktop app on Windows, not the Claude Code CLI. Multiple users and outlets reported in mid-2026 that once Claude Cowork or agent mode is used even a single time, Claude Desktop starts a Hyper-V-backed virtual machine on every subsequent launch visible in Task Manager as a Vmmem process using roughly 1.8–2GB of RAM even in plain chat sessions that never touch agent features. If you're specifically using Claude Desktop on Windows (rather than the terminal-based CLI this article otherwise focuses on) and see a persistent Vmmem process, this is the likely explanation.
How to identify it: You're on Windows, using the Claude Desktop app (not the CLI), you've used Cowork or agent mode at least once, and Task Manager shows a Vmmem process consuming memory even in idle chat sessions.
8. Session logs bloated by MCP tool output
If you use MCP servers that return large binary-style payloads a commonly cited example is a browser-automation server like Playwright returning base64-encoded screenshots that data gets written into the session's log files. Over many screenshots and sessions, those logs can balloon to well over 100MB, and Claude Code loading or referencing that history can pull the bloat into memory.
How to identify it: Check your Claude Code session log directory for unusually large log files, especially on projects using screenshot- or browser-based MCP tools.
9. Search and indexing issues (indirect contributor)
Search performance problems such as the bundled ripgrep binary failing to run on your system don't directly cause memory bloat, but they can push you toward workarounds (like asking Claude to read entire large files instead of searching within them) that do increase memory and context usage.
Step-by-Step Solutions to Reduce Claude Code Memory Usage
Step 1: Compact your context regularly
Run /compact during a session to summarize and shrink the accumulated conversation context.
Why it works: Most of Claude Code's session memory is tied to the context it's holding — file contents, command output, prior turns. Compacting reduces that footprint directly.
Expected result: Memory usage should drop after compaction. If you see Not enough messages to compact., your context may already be full from a single large paste rather than many turns — in that case, move to Step 4 (subagents) or Step 5 (/clear) instead.
Step 2: Exclude large build and dependency directories
Add large generated folders (build output, node_modules, .venv, compiled artifacts) to your project's .gitignore.
Why it works: Claude Code is designed to work with your project structure, and excluding directories that don't need to be scanned or indexed reduces what it has to track.
Expected result: Lower baseline memory usage when working in that project, especially on large repositories.
Step 3: Isolate the cause with safe mode
Restart Claude Code using:
bash
claude --safe-mode
Why it works: This flag disables all plugins, hooks, and customizations for the session. If memory usage drops significantly, one of your customizations is the source.
Expected result: If the problem disappears, work through your configuration individually to find the specific plugin, hook, or MCP server responsible (Anthropic's "Debug your configuration" guide covers this process in detail).
Step 4: Offload large files to a subagent
For very large individual files, ask Claude to delegate that work to a subagent, which runs in its own separate context window, or ask it to read the file in smaller chunks (a specific line range or function) instead of the whole thing.
Why it works: This prevents one oversized file from ballooning your main session's context, and is also the documented fix for "Autocompact is thrashing" errors, where compaction succeeds but immediately refills.
Expected result: The main session's memory footprint stays lower while the large-file work happens separately.
Step 5: Clear context or restart between tasks
If earlier conversation history is no longer needed, run /clear. Alternatively, close Claude Code and restart it between major, unrelated tasks — this does not lose your session, since running claude --resume in the same directory picks it back up.
Why it works: Starting fresh releases accumulated context that isn't relevant to your current task.
Expected result: Memory usage resets to baseline for the new task.
Step 6: Run diagnostics if memory stays high
If none of the above resolves it, run:
/heapdump
Why it works: This writes two files to your Desktop (or home directory on Linux without a Desktop folder): a JavaScript heap snapshot and a memory breakdown file. It also prints a summary in the conversation showing resident set size, JS heap, array buffers, and any detected leak indicators, and tells you whether the memory is in the JS heap (which the snapshot captures) or in native memory (which it doesn't).
Expected result: You'll know whether this is a JS-heap issue you (or a report) can investigate further, or a native-memory issue that needs to go straight to a bug report.
⚠️ Warning: The .heapsnapshot file contains every string in the process, including your full conversation and any credentials. Never attach it to a public GitHub issue — only the -diagnostics.json file is safe to share, since it contains statistics without conversation content.
Step 7: Check for and clear orphaned processes
Periodically check your process list for leftover Node.js, headless browser, or MCP-related processes that persist after you've fully closed Claude Code, and end any that are clearly orphaned.
Why it works: Orphaned child processes from crashed or force-quit sessions keep consuming RAM independently of whatever Claude Code is doing right now. Some users have automated this cleanup with community-built scripts that hook into session-end events, but manually checking Activity Monitor/Task Manager periodically works just as well for occasional use.
Expected result: Freed-up memory that was previously tied up in processes no longer connected to an active session.
Step 8 (Claude Desktop on Windows only): Deal with the Vmmem virtual machine
If you're on Claude Desktop for Windows and see a persistent Vmmem process after using Cowork or agent mode, you have two options: manually end the VM-related processes after each launch, or disable Windows' virtualization platform feature if you don't use Cowork, agent mode, WSL2, or Docker Desktop, via PowerShell (run as Administrator):
powershell
Disable-WindowsOptionalFeature -Online -FeatureName "VirtualMachinePlatform" -NoRestart
Why it works: This stops Windows from provisioning the Hyper-V-backed virtual machine that Cowork/agent mode initializes.
Expected result: The Vmmem process no longer appears on launch.
⚠️ Warning: Only disable VirtualMachinePlatform if you're not relying on it elsewhere — it's also used by WSL2 and Docker Desktop, so disabling it will break those if you use them. This fix applies to the Claude Desktop app specifically, not the Claude Code CLI.
Step 9 (advanced, Linux servers): Cap memory with cgroups
If you run Claude Code as a long-lived or 24/7 process on a Linux server (for example, inside tmux sessions), consider setting a hard memory ceiling using cgroups (memory.max and memory.high) at the service or slice level.
Why it works: A hard cap prevents a single runaway session from consuming all available system RAM and taking down SSH access or other services, turning a full server freeze into a contained, recoverable failure.
Expected result: If Claude Code hits a memory leak, only that constrained slice is affected instead of the whole machine locking up.
Step 10: Update Claude Code
Run claude doctor from your shell (or /doctor inside a session) to check your installation and get proposed fixes.
Why it works: Some memory-related bugs are version-specific. At least one publicly reported case of 50GB+ memory usage on Linux was resolved simply by updating to a newer release.
Expected result: If you were on an outdated version, the issue may already be patched.
Impact and Limitations
High memory usage isn't just an inconvenience in the more severe, leak-related cases reported on GitHub, users described full OOM kills that terminated Claude Code mid-session (losing context) and, in at least one case, a complete system freeze requiring a hard reboot. That's a meaningful reliability and productivity cost for anyone running extended coding sessions.
It's worth being precise about what's confirmed and what isn't:
Confirmed: Anthropic's own documentation acknowledges high CPU/memory as a known issue class and provides built-in diagnostic tooling (/heapdump, --safe-mode, /doctor) specifically for it.
Confirmed: Multiple independently filed GitHub issues, some with detailed reproduction steps and OOM kill logs, describe memory usage far beyond normal session activity.
Not confirmed: There's no single official statement identifying one universal root cause covering every reported case. The causes above reflect what's been documented across separate issues and the official troubleshooting page, not one confirmed underlying bug.
Common Mistakes to Avoid
Letting sessions run indefinitely without compacting. Context accumulates silently; by the time memory usage is obviously high, you've likely lost a lot of headroom you could have reclaimed earlier with regular /compact use.
Attaching a .heapsnapshot file to a public bug report. This file contains your full conversation and any credentials that were in memory. Only the -diagnostics.json file is safe to share publicly.
Assuming it's always a leak. Before reporting a bug, rule out large uncommitted build directories and third-party plugins/hooks/MCP servers with --safe-mode a large share of reported cases trace back to configuration, not core defects.
Repeatedly restarting instead of diagnosing. Restarting is a legitimate short-term workaround, but if the same growth pattern recurs every session, it's worth running /heapdump and filing a report rather than treating restarts as a permanent fix.
Blaming Claude Code for what a custom hook is doing. In at least one documented case, a user spent days debugging what looked like a Claude Code memory leak; it turned out to be a custom macOS audio-notification hook repeatedly calling coreaudiod, which was the actual source of the leak. Always test with --safe-mode before concluding the core tool is at fault.
Confusing "Claude Code memory problem" search results with RAM issues. A lot of content under that exact phrase is about cross-session context continuity (Claude forgetting prior decisions), not system memory. Make sure any fix you're following actually addresses RAM usage, not context/CLAUDE.md behavior.
Best Practices and Prevention Tips
Run /compact proactively during long sessions rather than waiting until performance degrades.
Keep .gitignore up to date so build artifacts and dependency folders aren't unnecessarily scanned.
Periodically run claude doctor / /doctor to catch outdated installs or configuration problems early.
When working with especially large files, ask Claude to read specific sections or delegate to a subagent instead of loading the entire file into the main context.
If you rely on plugins, hooks, or MCP servers, test new ones in isolation (or against --safe-mode as a baseline) before assuming they're memory-neutral.
If you do hit a severe or recurring case, use /heapdump and file a GitHub issue with the -diagnostics.json output this is how several of the documented leak reports surfaced in the first place.
Frequently Asked Questions
Some resource usage is expected, especially on large codebases or long sessions Anthropic's documentation describes this as normal. Continuous, unbounded growth or usage in the tens of gigabytes is not expected and points to one of the causes covered above.
Run /heapdump. It prints a summary directly in your session, including any detected leak indicators such as an unusually high memory growth rate.
Temporarily, yes — restarting resets memory to baseline. It's a legitimate workaround, but if the same growth pattern comes back every session, treat it as a symptom to diagnose rather than something to just restart through indefinitely.
Yes. Anthropic explicitly built --safe-mode to isolate this possibility, and at least one publicly reported case involved a status-line plugin correlating with rapid process spawning and memory growth.
It might. At least one documented high-memory case on Linux was resolved by updating to a newer release, so checking your version with claude doctor is a reasonable early step before deeper troubleshooting.
No. It contains your full conversation and any credentials present in memory. Only share the accompanying -diagnostics.json file, which contains statistics without conversation content.
Yes — excluding large build or dependency directories from what Claude Code scans, and asking it to read large files in chunks or via a subagent rather than in full, both reduce the memory footprint of a session.
This idle-growth pattern is one of the most widely reported forms of the issue, documented across Windows, macOS, Linux, and WSL2, with growth rates ranging from tens of megabytes to a couple of gigabytes per minute in some reports. It isn't tied to context size in every case, and as of this writing it doesn't have a confirmed official fix — periodic restarts remain the practical workaround.
Likely an orphaned child process (an MCP server, subagent, or headless browser instance) that didn't get cleaned up when the session ended abnormally. Check your process list for leftover Node.js or browser processes and end them manually.Is the Windows "Vmmem" memory issue the same as the Claude Code CLI memory problem?
No. The Vmmem/Hyper-V issue is specific to the Claude Desktop app on Windows after using Cowork or agent mode — it's unrelated to memory usage in the terminal-based Claude Code CLI.
Conclusion
Claude Code high memory usage ranges from normal, if heavy, resource consumption during long sessions on large codebases, to genuine, widely documented leaks idle sessions that keep growing with no activity, orphaned child processes left behind after crashes, and version-specific bugs that have pushed usage past 100GB and triggered OOM kills or system freezes in some reported cases. Windows Claude Desktop users chasing a persistent Vmmem process are dealing with a related but separate issue tied to Cowork/agent mode, not the CLI itself.
The distinction matters: most everyday cases resolve with /compact, sensible .gitignore hygiene, and isolating plugins, hooks, or MCP servers with --safe-mode. For the more severe, persistent cases, Anthropic's built-in /heapdump diagnostic tells you whether you're looking at a JS-heap issue you can inspect yourself or a native-memory issue worth reporting directly.
If you're hitting this regularly, the practical order of operations is: compact and clean up your project first, isolate customizations with safe mode second, and only after that turn to diagnostics and a bug report. Combined with keeping Claude Code updated, this covers the fixes for the vast majority of memory complaints reported so far.